The Kenya Institute of Curriculum Development publishes the national Competency-Based Curriculum as PDF documents. One per subject, per grade, per education level. Collectively, these documents run to over two thousand pages of strands, sub-strands, learning outcomes, suggested activities, and assessment guidance spanning Pre-Primary 1 through Grade 12. This is the raw material. The Curriculum Graph Engine — CGE — is what ROAN built to turn it into a computable data structure. Not a searchable database. Not a tagged content library. A directed acyclic graph where every node is a curriculum entity and every edge carries structural meaning. This post explains what that means, why we chose a graph over a table, and how the architecture works.
The source material
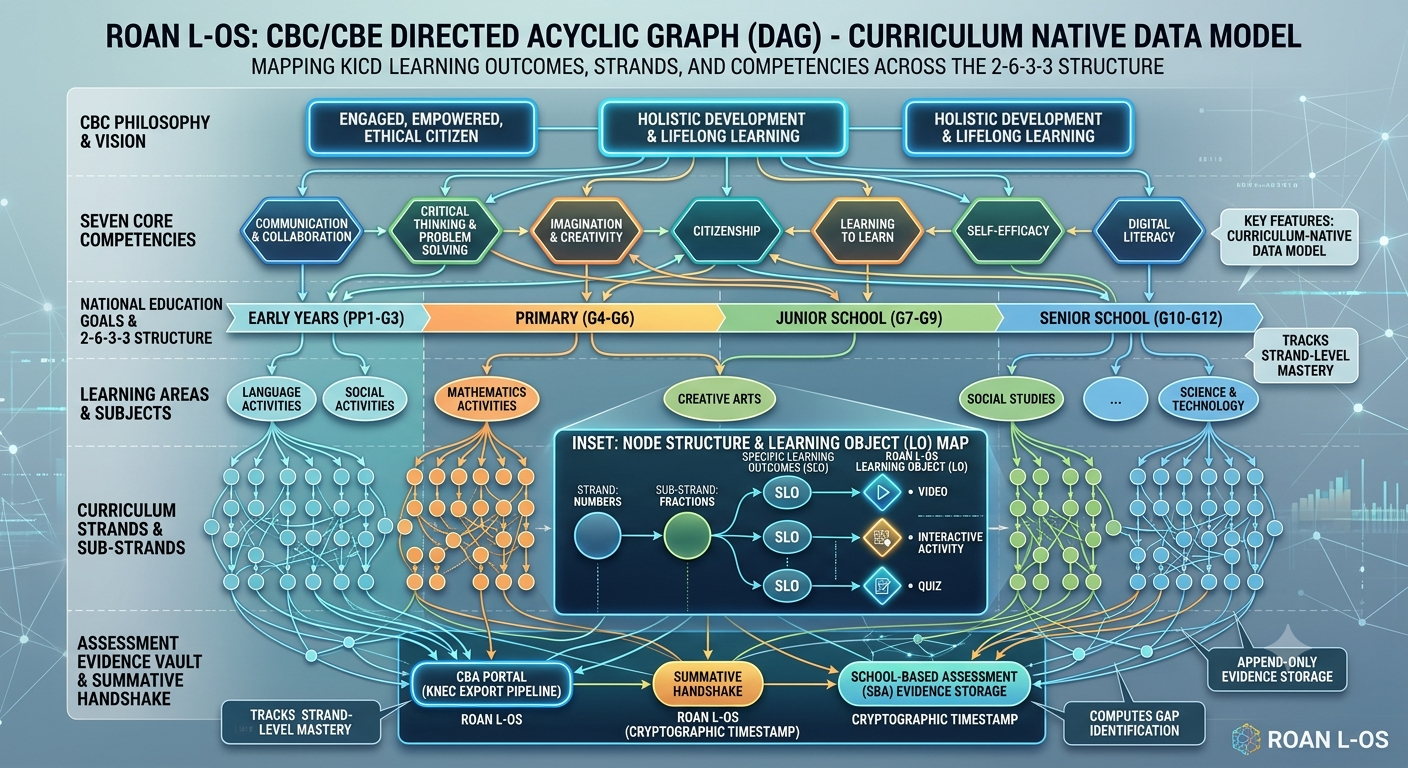
Kenya's CBC is organised into four education tiers, each with its own structural characteristics. Early Years Education covers PP1 through Grade 3 — formative assessment only, non-ranking, with nine learning areas including Literacy, Numeracy, and Environmental Activities. Lower and Upper Primary span Grades 1 through 6, introducing summative assessment alongside SBA. Junior Secondary covers Grades 7 through 9 with a dual-window SBA model. Senior Secondary spans Grades 10 through 12, introducing three pathways (Arts & Sports, Social Sciences, STEM), seven tracks, and 571 valid subject combinations.
Each subject at each grade level has a curriculum design document. The document specifies strands (broad thematic areas), sub-strands (topics within strands), and learning outcomes (specific competencies a learner should demonstrate). It specifies suggested lesson counts per sub-strand. It specifies assessment expectations. For language subjects, it adds a theme layer above the strand level. For Senior Secondary, it specifies pathway and track membership rules.
All of this arrives as prose in a PDF. The question is: what data structure should it become?
Why not a table?
The instinctive answer is a relational database. Define a table for subjects, a table for strands, a table for sub-strands, a table for learning outcomes. Connect them with foreign keys. This is how most education platforms represent curriculum data, and it works for simple cases.
It breaks for three reasons.
First: the hierarchy is not uniform. Most subjects have a three-level hierarchy: strand → sub-strand → learning outcome. Language subjects have four: theme → strand → sub-strand → learning outcome. Senior Secondary adds pathway and track as structural containers above the subject level. A relational schema must either impose a single hierarchy depth (losing structural information) or create nullable columns and conditional joins (adding complexity that scales poorly). The hierarchy is not a fixed tree. It is a graph with variable depth per subject family.
Second: the relationships carry weight. A sub-strand does not merely "belong to" a strand. It has a KICD-suggested lesson count that determines its share of the annual teaching allocation. It has a KNEC assessment weight that determines how heavily it features in summative evaluation. It may have prerequisite relationships with sub-strands in the same subject at the preceding grade level. It may have co-requisite relationships with sub-strands in adjacent subjects at the same grade level. These are not foreign keys. They are weighted, typed edges — and the weights are used in computations (lesson distribution, assessment weighting) that drive platform behaviour.
Third: traversal patterns are graph-native. The questions the platform needs to answer — "what should this student learn next?", "which sub-strands contribute to this KNEC assessment tier?", "what is the prerequisite chain for this Grade 9 outcome back to Grade 4?" — are traversal queries. In a relational database, each requires recursive CTEs or application-level iteration. In a graph database, each is a single traversal operation. The query patterns match the data structure.
A curriculum is not a list of things to learn. It is a network of relationships between things to learn. The data structure should reflect that.
The directed acyclic graph
CGE models the KICD curriculum as a directed acyclic graph stored in Neo4j. "Directed" means edges have a direction — a strand contains a sub-strand, not the reverse. "Acyclic" means there are no circular dependencies — you cannot follow edges from a node and arrive back at the same node. This constraint is essential for curriculum integrity: a learning outcome cannot be its own prerequisite.
Nodes Every entity in the KICD curriculum becomes a node in the graph. The node types are:
Education Level — the tier container: EYE, Lower Primary, Upper Primary, Junior Secondary, Senior Secondary. Each carries tier-specific properties: grading scale (four-level or eight-level), assessment weighting model, and national examination endpoint (KEYA, KPSEA, KJSEA, KCSEA).
Subject — a learning area within a tier, carrying the KICD-specified lessons per week (LPW). Mathematics at Junior Secondary has LPW 5. Creative Arts & Sports at Junior Secondary has LPW 5. Religious Education at Pre-Primary has a 90-lesson annual override (a KICD design constant). The LPW value is the hard ceiling for weekly lesson scheduling — the distribution engine cannot exceed it.
Theme — present only in language subjects (English, Kiswahili, Indigenous Languages). Themes group strands under a contextual heading: "My Family and Friends," "Our Environment," "Health and Hygiene." In the graph, themes sit above strands in the hierarchy, adding a fourth depth level for language subject traversals.
Strand — a broad thematic area within a subject. "Numbers and Operations" in Mathematics. "Kusikiliza na Kuzungumza" (Listening and Speaking) in Kiswahili. Each strand carries a strand number used in the CGE code generation.
Sub-Strand — the operational unit of curriculum delivery. Each sub-strand has a KICD-suggested lesson count (the weight input to the distribution engine), a KNEC assessment weight tier (standard, high, or low), and a set of learning outcomes. The sub-strand is the level at which teachers plan lessons, the level at which formative assessment is organised, and the level at which summative narratives are structured.
Learning Outcome — the finest-grained node. Each outcome describes a specific competency: "identify equivalent fractions in real-life contexts," "use appropriate punctuation in written communication." Learning outcomes are the assessed unit in formative evaluation — each one receives a competency level (EE/ME/AE/BE at PP1–Grade 9, or EE1 through BE2 at Senior Secondary). They are stored as pipe-delimited values in the CGE upload template and parsed into individual nodes during ingestion.
Edges
Edges are typed and weighted. The primary edge types are:
CONTAINS — hierarchical containment. An Education Level contains Subjects. A Subject contains Strands (or Themes, which contain Strands). A Strand contains Sub-Strands. A Sub-Strand contains Learning Outcomes. These edges define the traversal hierarchy.
PREREQUISITE — cross-grade dependency. A Grade 5 Mathematics sub-strand on fractions may have a prerequisite edge to the Grade 4 sub-strand on basic fractions. These edges enable the "prerequisite chain" traversal: given a gap in Grade 7, trace back through the graph to find where the foundation was laid.
ASSESSMENT_WEIGHT — the edge between a sub-strand and its KNEC assessment tier. This weight determines how the sub-strand contributes to the summative score computation. The Summative Handshake system uses these edges to aggregate sealed formative evidence into KNEC-compliant export records.
ALLOCATION — the computed edge between a sub-strand and its position in the annual schedule. This edge carries the CGE-computed lessons allocated (not the raw KICD suggestion), the week-start, week-end, weekly distribution array, and derived term placement. These values are outputs of the v4.7 distribution engine, not user inputs.
The dual-schema architecture
CGE does not run on Neo4j alone. The platform uses a dual-schema architecture: Neo4j for the curriculum graph and PostgreSQL for operational data.
The graph database holds the curriculum structure — the nodes, edges, weights, and relationships described above. It is the authority on what the curriculum is: what outcomes exist, how they relate, what weights they carry, where they sit in the annual schedule. Graph queries are used for traversal operations: "find all sub-strands in this subject at this grade," "trace the prerequisite chain for this outcome," "compute the assessment weight distribution for this KNEC tier."
The relational database holds operational state — what has happened in schools. Student enrolment, teacher assignments, competency observations (formative assessments), summative scores, lesson delivery records, attendance, fees. PostgreSQL is the authority on what has been done: which lessons have been delivered, which outcomes have been assessed, which students have gaps.
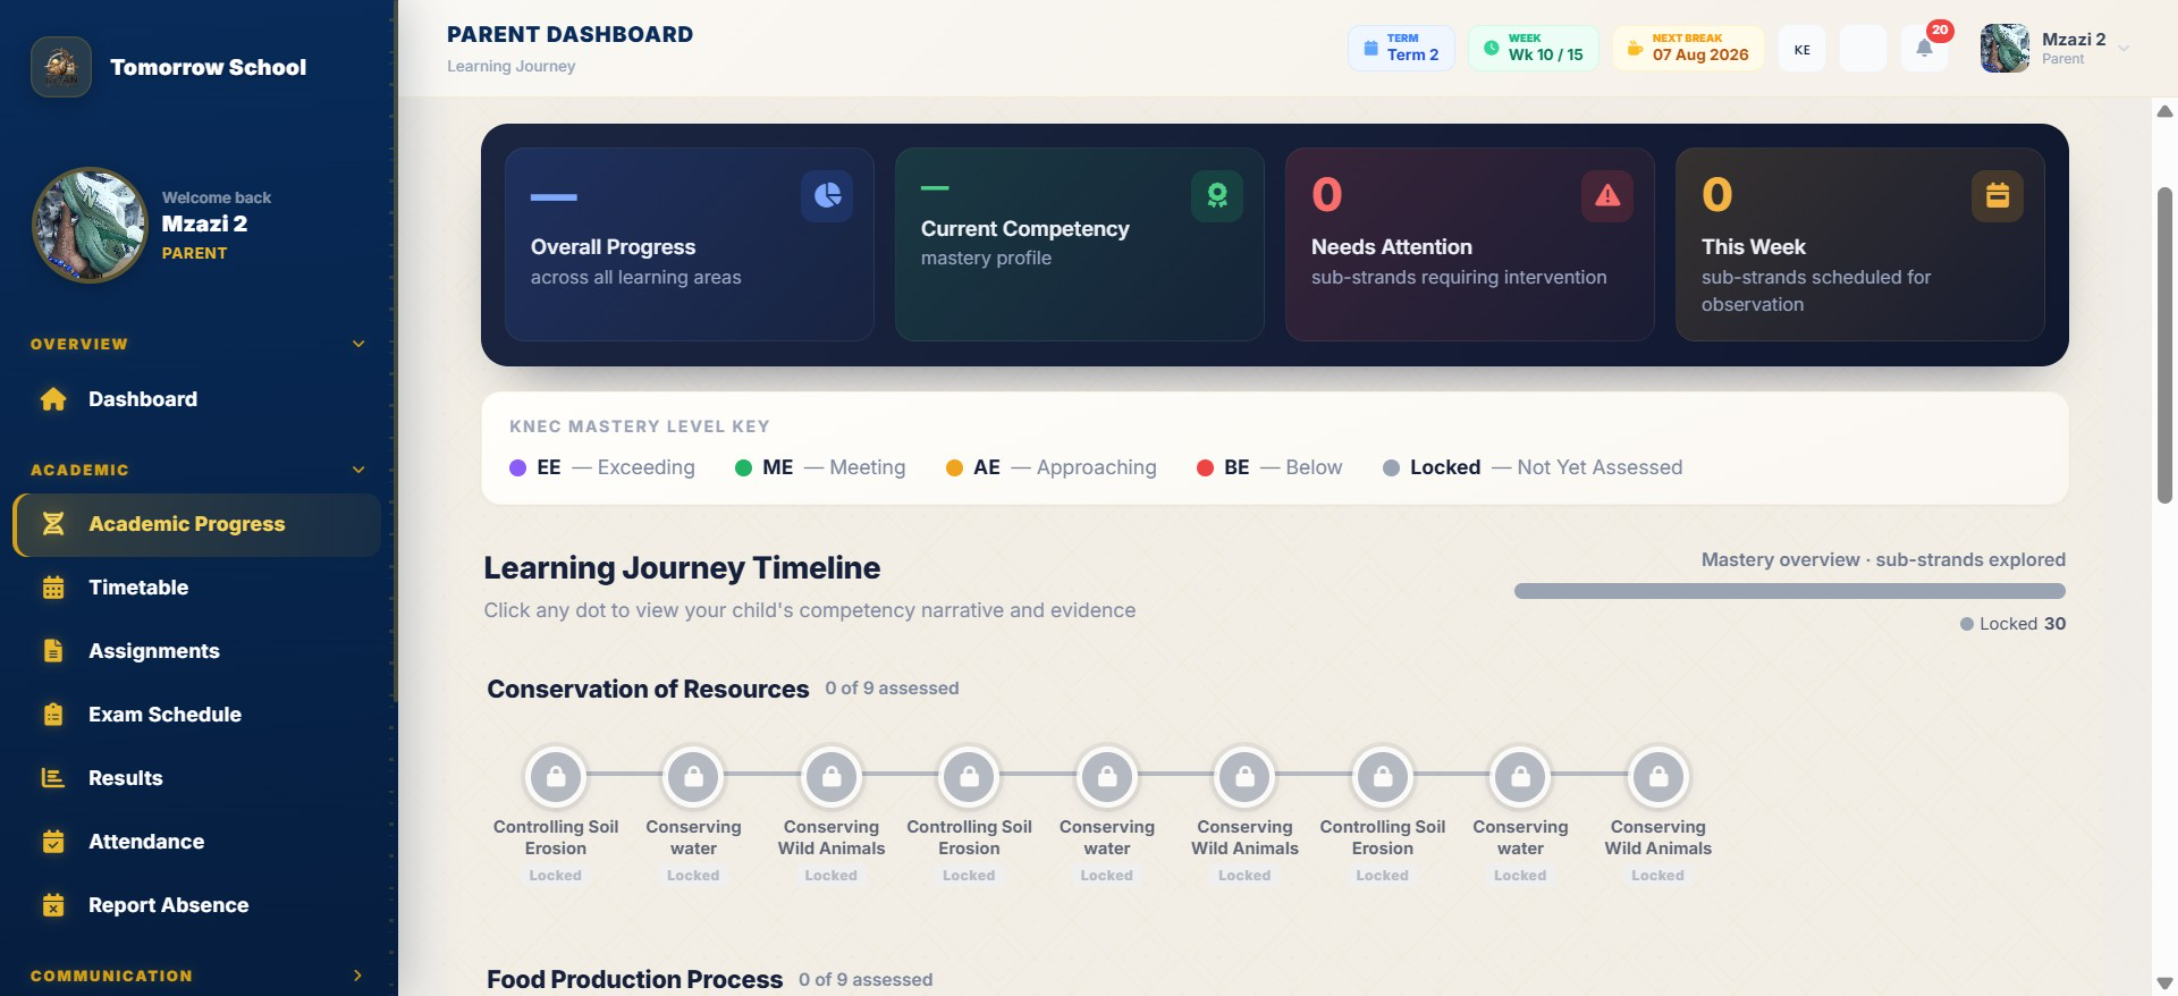
The Bridge service — a Node.js event bus with 37+ event types — connects the two. When a teacher seals a competency observation (a formative assessment against a specific learning outcome), the Bridge validates the observation against the graph (does this outcome exist at this grade for this subject?), persists the operational record in PostgreSQL, and emits a COMPETENCY_UPDATED event that triggers downstream updates: parent dashboard refresh, school admin aggregate recalculation, KNEC export pipeline queue entry.
The graph knows what should happen. The relational database knows what has happened. The Bridge connects intention to reality.
This separation is deliberate. Graph databases excel at relationship traversal but are not optimised for the high-write, high-read transactional workloads of operational school data. Relational databases excel at transactional integrity but cannot efficiently represent or traverse variable-depth hierarchies with weighted, typed edges. Using both — each for what it does best — avoids the architectural compromise of forcing one database to do both jobs badly.
The distribution engine
The CGE graph does not merely store curriculum structure. It computes from it. The v4.7 weight-balanced distribution engine takes two inputs — the KICD-suggested lesson counts per sub-strand and the subject's lessons-per-week ceiling from the KICD capacity table — and produces the lesson allocation and term placement for every sub-strand across the 27-week teaching year (Term 1: weeks 1–10, Term 2: weeks 11–21, Term 3: weeks 22–27).
The algorithm is patent-pending and we do not disclose its internals here. What we can say is this: the engine guarantees zero overflow by construction. The sum of all allocated lessons equals the annual capacity exactly. No single week exceeds the KICD lessons-per-week ceiling. No manual entry is required — lesson allocations and term targets are engine outputs, never user inputs. These guarantees are not achieved through validation checks after the fact. They are mathematical properties of the algorithm itself. There is no bug surface for overflow because the computation cannot produce it.
The practical consequence is that when a school receives its curriculum schedule, every sub-strand has a precise position in the year — which weeks it occupies, how many lessons it receives per week, and which term it falls in. Sub-strands that span term boundaries (e.g., weeks 10–11) receive cross-term labels. This schedule is computed once at publication and inherited by every school that uses that subject at that grade level.
The distribution engine does not ask humans to plan the year. It computes the year from the curriculum graph and hands the plan to teachers ready-made.
The configurable education-level boundary
Kenya's 2-6-3-3 structure means that schools serve different combinations of education levels. An ECDE centre may offer only EYE (PP1–PP2). A primary school may offer EYE through Upper Primary. A secondary school may offer Junior Secondary through Senior Secondary. A comprehensive institution may offer everything from PP1 through Grade 12.
The CGE graph handles this through a configurable education-level boundary. When a school is provisioned, its offerings are specified: which education levels it serves. The graph does not filter itself — it contains the entire PP1-through-Grade-12 curriculum at all times. Instead, the school's offering acts as a lens: API queries for that school's curriculum data traverse only the relevant sub-graph. A school offering EYE and Lower Primary sees only the nodes and edges relevant to PP1 through Grade 3. A school offering Junior and Senior Secondary sees Grades 7 through 12.
The isSSS flag operates at this boundary. When any part of a school's offering includes Senior Secondary, the flag activates and reconfigures the interface: eight-level grading, pathway/track subject validation, the 571-combination matrix, T2-anchored practicals, and SSS-specific LPW allocations. The flag is not set by an administrator. It is derived from the school's position in the graph.
The CGE code
Every sub-strand in the graph receives a unique CGE code — a human-readable identifier that encodes its position in the curriculum hierarchy. The code format varies by tier: standard subjects use a compact grade-subject-strand-substrand notation, language subjects include a theme segment, and Senior Secondary codes include pathway identifiers. The code is generated automatically from the graph position during ingestion — no manual entry required.
The code serves three purposes: unique identification across the entire curriculum namespace, human readability for teachers and administrators who reference sub-strands in planning and reporting, and namespace collision prevention across the 911+ published curriculum entries currently in the system. When a teacher sees a CGE code on a lesson plan or assessment form, they can immediately identify the grade, subject, and structural position of that sub-strand without consulting the full curriculum document.
From PDFs to graph: the conversion pipeline
Converting KICD curriculum design PDFs into CGE graph data is a multi-stage process. The source PDFs are structured documents — they use consistent heading hierarchies and table formats — but they are not machine-readable. The conversion pipeline extracts strand/sub-strand structures, maps them to a structured upload template, validates structural integrity (no duplicate codes, no orphan outcomes, no missing weights), and ingests the validated data through the CGE API.
The upload template is deliberately minimal. It captures curriculum structure and KNEC assessment weight tiers — the inputs the engine needs. It does not include lesson allocations or term targets, because those are engine outputs. Including them would violate the architectural principle that the distribution engine is the single source of truth for scheduling. The distinction between what is an input and what is a computed output is one of the most important design decisions in the entire system.
The pipeline has processed subjects from PP1 through Grade 8 and beyond, with 911 published curriculum entries currently live in the system. Each entry represents a sub-strand with its full graph context: tier, subject, strand, outcomes, KICD weight, CGE-computed allocation, week positions, and term placement.
What the graph makes possible
The Curriculum Graph Engine is not a feature of ROAN L-OS. It is the kernel. Every other component in the platform — eight role-based dashboards, six AI integration points, three financial flows, the Summative Handshake evidence system, the Bridge event bus — operates on top of the graph. When a teacher opens the lesson planner, the graph determines which sub-strands are scheduled for that week. When a parent views the competency portfolio, the graph determines which outcomes to display and which gaps to surface. When the AI generates remedial content, the graph constrains what content can be generated and for whom.
The graph is the answer to the question we asked when we looked at 2,000 pages of KICD PDFs: what data structure should this become? Not a table. Not a document store. Not a tagged content library. A directed acyclic graph — because that is what a curriculum actually is.

ROAN Learning Designs
Building Kenya's sovereign learning operating system — CBC-native, curriculum-first infrastructure for every learner on the continent.
Get in touch